Expose the MicroK8s Dashboard Safely with Cloudflare Tunnel and systemd
The Kubernetes dashboard is the most useful tool on a homelab cluster and the most dangerous thing to leave on the open internet. A single misconfigured RBAC binding hands the keys to the entire cluster away. This guide pairs MicroK8s's bundled dashboard with a Cloudflare Tunnel so it stays reachable from anywhere without exposing a port — and uses systemd to keep the port-forward alive across reboots and tunnel reconnects.
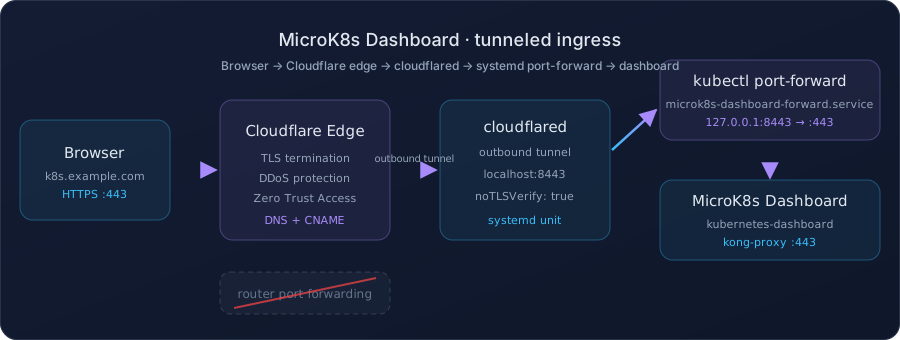
Why this shape
MicroK8s's dashboard isn't a thing you point a tunnel at directly — it's a Kubernetes
Service of type ClusterIP, which by definition has no external IP. The
dashboard addon (which is really kubernetes-dashboard
fronted by Kong) listens on :443 inside the cluster only. To reach it from the host
you have two options: an ingress with a NodePort, or a
kubectl port-forward. The first leaks a port on every node IP; the second stays on
127.0.0.1 where only the tunnel can see it.
- No NodePort, no public IP. The dashboard service stays
ClusterIP. - Loopback only. The port-forward binds
127.0.0.1:8443, so nothing on the LAN — let alone the internet — can hit it directly. - Cloudflare Access in front of it. Same gate you put in front of Cockpit; a one-time PIN before any token is requested.
- Self-healing.
systemdrestarts the port-forward if it dies, andcloudflaredreconnects automatically when the tunnel blips.
k8s.example.com is the public hostname
you'll route through Cloudflare, ops and admin are the two
dashboard service accounts. Replace both with your own values.
What you'll end up with
| Layer | Address | Owned by |
|---|---|---|
| Public URL | https://k8s.example.com | Cloudflare edge |
| Tunnel target on the host | https://localhost:8443 | cloudflared |
| systemd-managed port-forward | 127.0.0.1:8443 → kubernetes-dashboard-kong-proxy:443 | microk8s-dashboard-forward.service |
| Dashboard service | kubernetes-dashboard/kong-proxy:443 | MicroK8s dashboard addon |
Prerequisites
- MicroK8s installed and joined on a single node (
microk8s status --wait-readyshowsrunning) - A
cloudflaredtunnel already created and running on the same host — this guide assumes you've already done the Cockpit setup, so the daemon is installed and authenticated - A hostname in your Cloudflare zone (here,
k8s.example.com) that you can add a public hostname to
Step 1 — Enable the dashboard addon
sudo microk8s status --wait-ready
sudo microk8s enable dashboard
The addon pulls down the dashboard manifests and Kong (its ingress proxy) and waits for them to roll out. Confirm the service exists before continuing:
sudo microk8s kubectl get svc -A | grep dashboardYou should see:
kubernetes-dashboard kubernetes-dashboard-kong-proxy ClusterIP 10.152.183.123 <none> 443/TCP 3m
ClusterIP with no external IP is correct — that's the whole reason for the
port-forward in the next step. If the addon reports enabled in
microk8s status but the service is missing, give it another minute: Kong and the
dashboard rollout independently and the service only appears once both are ready.
Step 2 — Forward the dashboard to localhost
sudo microk8s kubectl -n kubernetes-dashboard port-forward \
  --address 127.0.0.1 \
  svc/kubernetes-dashboard-kong-proxy 8443:443
The dashboard is now reachable at https://127.0.0.1:8443. Two details are doing
real work here:
--address 127.0.0.1binds the listener to loopback only. Without it, kubectl binds to0.0.0.0and any host on your LAN can reach the dashboard — defeating the whole exercise.8443:443maps host loopback:8443to the service's:443. We use8443on the host because:443is where the tunnel and other services already live.
Try it interactively before going further. Ctrl+C to stop — in the next step
we'll hand this same command to systemd so it survives the next reboot.
Step 3 — Route it through the existing tunnel
Open the Cloudflare Zero Trust dashboard and go to Networks → Tunnels → your tunnel → Public Hostname → Add a public hostname. Fill in:
| Field | Value |
|---|---|
| Subdomain | k8s |
| Domain | example.com |
| Type | HTTPS |
| URL | localhost:8443 |
Under Additional application settings → TLS, turn on No TLS Verify. Kong serves its own self-signed certificate that won't match the public hostname, so verification would fail without it. The public leg of the connection (browser ↔ Cloudflare edge) is still fully verified TLS — this only relaxes the edge ↔ origin hop, exactly like the Cockpit route in the previous guide.
Save, then verify DNS and reachability:
dig +short k8s.example.comcurl -sk https://k8s.example.com | head -20
A Cloudflare-issued certificate on the response and dashboard HTML in the body mean the whole
chain is up. The browser will warn about an untrusted cert on 127.0.0.1:8443 only
if you've bypassed the tunnel and hit the port-forward directly — which you shouldn't be
doing from a browser anyway.
cluster-admin. Treat k8s.example.com the same way: require an
email OTP before any token is even requested. Five minutes in Zero Trust beats a leaked
token rotation any day.
Step 4 — Keep the port-forward alive with systemd
The kubectl port-forward from Step 2 is a foreground process — the moment your
SSH session closes or the host reboots, it dies. Tunnel reconnects can't reach the dashboard
if nothing is listening on 127.0.0.1:8443. systemd fixes this in about a dozen
lines:
sudo nano /etc/systemd/system/microk8s-dashboard-forward.service[Unit]
Description=MicroK8s Dashboard Port Forward
After=network-online.target snap.microk8s.daemon-kubelite.service
Wants=network-online.target
Requires=snap.microk8s.daemon-kubelite.service
[Service]
Type=simple
ExecStart=/snap/bin/microk8s kubectl -n kubernetes-dashboard port-forward --address 127.0.0.1 svc/kubernetes-dashboard-kong-proxy 8443:443
Restart=always
RestartSec=5
[Install]
WantedBy=multi-user.targetThree lines are doing the actual work:
Requires=snap.microk8s.daemon-kubelite.servicemakes systemd refuse to start the unit until kubelite (MicroK8s's API server) is up. Without it, the unit races the API server on boot and fails a few times before settling.Restart=always+RestartSec=5is the self-healing part. The port-forward occasionally drops when the API server restarts for an addon upgrade — this re-establishes it without intervention.WantedBy=multi-user.targetstarts it at boot, in the normal services runlevel.
Reload systemd, enable the unit, and start it:
sudo systemctl daemon-reload
sudo systemctl enable --now microk8s-dashboard-forward.service
sudo systemctl status microk8s-dashboard-forward.serviceenable --now shorthand. It enables the unit at boot and
starts it immediately, in one command. enable alone only flips the boot flag;
start alone only starts it once. For new units you almost always want both.
Step 5 — Create the admin service accounts
The dashboard ships with no default user. Create the accounts you want, bind them to
cluster-admin (full control), and mint a bearer token for each. The dashboard
treats these accounts as distinct users — they show up separately in the audit log, so two
accounts is more useful than one shared one.
The first:
sudo microk8s kubectl create serviceaccount ops -n kubernetes-dashboard
sudo microk8s kubectl create clusterrolebinding ops \
  --clusterrole=cluster-admin \
  --serviceaccount=kubernetes-dashboard:ops

sudo microk8s kubectl -n kubernetes-dashboard create token ops
The second, same shape:
sudo microk8s kubectl create serviceaccount admin -n kubernetes-dashboard
sudo microk8s kubectl create clusterrolebinding admin \
  --clusterrole=cluster-admin \
  --serviceaccount=kubernetes-dashboard:admin

sudo microk8s kubectl -n kubernetes-dashboard create token admincluster-admin on your cluster. They're valid for one hour by default; mint them
at login time rather than storing them. Never paste them into chat, screenshots, or version
control. If one leaks, delete the service account and recreate it — there's no concept of
"rotating" a token without invalidating every existing session of that user.
Step 6 — Log in
Open https://k8s.example.com. If you've put the hostname behind Cloudflare
Access, complete the email OTP first. On the dashboard's sign-in page, choose
Token, paste either token from Step 5, and you land in the cluster overview.
Tokens expire after one hour by default. If you find yourself minting new tokens several times a day, the dashboard's session is doing what it should — a long-lived admin token sitting in a browser is exactly the failure mode this design avoids.
Step 7 — Useful checks
# Cluster and addon status
sudo microk8s status
sudo microk8s kubectl get pods -n kubernetes-dashboard
sudo microk8s kubectl get svc -n kubernetes-dashboard

# Port-forward itself
sudo systemctl status microk8s-dashboard-forward.service
sudo ss -lntp | grep 8443
sudo journalctl -u microk8s-dashboard-forward.service -n 50 --no-pager
When something breaks, run these in order. Most failures are visible at one of three layers:
the addon (microk8s status), the port-forward (ss -lntp for the
listener, journalctl for the unit), or the public route (dig for DNS,
then a curl -sk from outside).
Troubleshooting
| Symptom | Cause and fix |
|---|---|
Dashboard service missing after enable dashboard | Kong and the dashboard rollout independently. Wait a minute and rerun kubectl get svc -A. |
port-forward exits immediately | Wrong service name or namespace. Verify with kubectl get svc -n kubernetes-dashboard. |
connection refused on 127.0.0.1:8443 | Unit not running. systemctl status microk8s-dashboard-forward.service. |
Unit fails on boot with connection refused | Port-forward raced the API server. Requires=snap.microk8s.daemon-kubelite.service in the unit fixes this — Step 4. |
| 522 from Cloudflare on the public URL | Tunnel is up but 127.0.0.1:8443 isn't. Check the systemd unit, not cloudflared. |
| 526 from Cloudflare on the public URL | TLS handshake failed origin-side. No TLS Verify must be ON for that public hostname (Step 3). |
| Dashboard logs in but namespaces look empty | Token bound to a ServiceAccount without cluster-wide view. Check the ClusterRoleBinding with kubectl get clusterrolebinding ops -o yaml. |
Forbidden everywhere after login | Token created in the wrong namespace. Tokens are namespace-scoped to the ServiceAccount — make sure you're minting from -n kubernetes-dashboard. |
Closing notes
What holds this setup together isn't the tunnel — it's the three boundaries that never
collapse: the dashboard service stays ClusterIP, the port-forward stays on
loopback, and the public hostname stays behind Cloudflare Access. Each one is a single
configuration line. Take any of them away and the attack surface grows back in the same
place you cut it.
The systemd unit is the smallest piece but the easiest to skip. Without it the tunnel reaches nothing on every reboot and you only notice when you actually need the dashboard. Treat it like any other boot-time service and you stop thinking about it entirely.
← All blogs